People live in space and feel a connection to the space in which they live. We feel a connection to our street, our village, or even our city. We feel a connection to the region that shapes a significant part of our identity. Since administrative boundaries often largely coincide with ethnic-cultural and physical-geographical boundaries, we also feel a connection to the administrative unit in which we operate day in and day out. An example of this is a county. For us, that is Baranya. Our Baranya.
From time to time, the question arises in public discourse as to whether a given county receives enough EU development funds from the national pool to meet what it considers its fair share. This is a natural competition stemming from identity, for who would not want to see their environment—the natural and administrative space that shapes them—regarded with the same esteem?
This is, of course, largely a subjective measure, but it is neither scientifically grounded nor provable. Fortunately, however, there are objective factors and indicators that bring us closer to the truth, even if they cannot provide the full picture.
An examination of the recently concluded 2014–2020 EU funding period is perfectly suited for this purpose. Due to the so-called n+3 rule, investments were completed everywhere in the country by the end of 2023 (with only one or two exceptions), meaning we are able to examine the actual situation (the completed state).
From publicly available data accessible to anyone, it can be determined how much total EU funding was requested for projects planned to be implemented in a given county (and, specifically in our study, in Budapest)—including a breakdown by operational program— how many grant applications this entailed, how many proposals were approved, and what the actual value of the funding was. This includes the following operational programs:
- Human Resources Development Operational Program
- Economic Development and Innovation Operational Program
- Integrated Transport Development Operational Program
- Operational Program for the Environment and Energy Efficiency
- Operational Program for the Development of Public Administration and Public Services
- Hungarian Fisheries Operational Program
- Regional and Urban Development Operational Program
- Competitive Central Hungary Operational Program
- Rural Development Program
If we filter out the data of public interest, we see that there was intense interest nationwide in the specific investments (i.e., those not on a national scale and not directly implemented by the government or government agencies) planned for the counties
- Domestic civil society, business, local government, and state actors submitted a total of 489,932 grant applications for the above-mentioned operational programs, of which 21,625 (4.41%) came from Baranya County,
- The total funding requested for the submitted projects amounted to more than 20,600 billion HUF (of which 704.4 billion HUF is allocated to Baranya County, representing 3.42%),
- Under these programs, a total of 357,885 grant applications were approved nationwide (15,106 in Baranya County), with the total value of the grants awarded amounting to 14,044 billion HUF, of which more than 422 billion HUF was allocated to Baranya, representing 3.01% of the national total.
Having said that, let’s see how the 20 units examined (19 counties and Budapest) rank in terms of the grants awarded:
| Ranking | Administrative unit examined | Total EU funding awarded in the 2014–2020 cycle |
| 1 | Budapest | 7,172,059,694,542 HUF |
| 2 | Szabolcs-Szatmár-Bereg | 702,696,089,102 HUF |
| 3 | Hajdú-Bihar | 677,209,017,392 HUF |
| 4 | Bács-Kiskun | 577,781,204,354 HUF |
| 5 | Borsod-Abaúj-Zemplén | 554,401,415,695 HUF |
| 6 | Csongrád-Csanád | 456,628,513,902 HUF |
| 7 | Baranya | 422,415,366,321 HUF |
| 8 | Győr-Moson-Sopron | 419,481,563,728 HUF |
| 9 | Pest | 346,221,749,421 HUF |
| 10 | Somogy | 338,051,361,774 HUF |
| 11 | Békés | 326,387,677,758 HUF |
| 12 | Jász-Nagykun-Szolnok | 320,358,881,802 HUF |
| 13 | Veszprém | 279,989,944,477 HUF |
| 14 | Fejér | 278,662,923,480 HUF |
| 15 | Heves | 260,347,116,519 HUF |
| 16 | Zala | 210,918,434,192 HUF |
| 17 | Tolna | 202,685,221,221 HUF |
| 18 | Komárom-Esztergom | 178,949,276,351 HUF |
| 19 | Vas | 175,039,130,103 HUF |
| 20 | Nógrád | 144,484,180,688 HUF |
It is hardly surprising that Budapest ranks far ahead of the rest in terms of the amount of funding awarded: projects in Budapest received more funding than all the counties combined.
Baranya ranks seventh in this list, so even if we consider only the amount of funding awarded, it has nothing to be ashamed of, especially given that it significantly outperforms Somogy and Tolna counties in the South Transdanubia Region.
It is important to note, however, that the amount of grants awarded does not, on its own, provide an accurate picture of a county’s actual standing in terms of development policy, since it makes a difference whether a €1,000 development policy grant goes to a county with 300,000 residents or one with 100,000 residents.
For this reason, our study also examined the value of the grants awarded per county resident, based on publicly available data and the official figures from the 2022 census. The indicators in tabular form:
| Ranking | Administrative unit examined | Total EU funding awarded during the 2014–2020 cycle | Population according to the 2022 census | EU funding per capita in the county for the 2024–2020 EU cycle |
|---|---|---|---|---|
| 1 | Budapest | 7,172,059,694,542 HUF | 1,685,342 | 4,255,552 HUF |
| 2 | Szabolcs-Szatmár-Bereg | 702,696,089,102 HUF | 529,381 | 1,327,392 HUF |
| 3 | Hajdú-Bihar | 677,209,017,392 HUF | 519,141 | 1,304,480 HUF |
| 4 | Baranya | 422,415,366,321 HUF | 354,022 | 1,193,190 HUF |
| 5 | Csongrád-Csanád | 456,628,513,902 HUF | 391,184 | 1,167,299 HUF |
| 6 | Bács-Kiskun | 577,781,204,354 HUF | 495,318 | 1,166,485 HUF |
| 7 | Somogy | 338,051 361,774 HUF | 293,470 | 1,151,911 HUF |
| 8 | Békés | 326,387,677,758 HUF | 315,222 | 1,035,422 HUF |
| 9 | Tolna | 202,685,221,221 HUF | 207,931 | 974,772 HUF |
| 10 | Heves | 260,347,116,519 HUF | 285,892 | 910,648 HUF |
| 11 | Jász-Nagykun-Szolnok | 320,358,881,802 HUF | 355,809 | 900,368 HUF |
| 12 | Győr-Moson-Sopron | 419,481,563,728 HUF | 465,945 | 900,281 HUF |
| 13 | Borsod-Abaúj-Zemplén | 554,401,415,695 HUF | 623,024 | 889,856 HUF |
| 14 | Veszprém | 279,989,944,477 HUF | 335,361 | 834,891 HUF |
| 15 | Zala | 210,918,434,192 HUF | 260,800 | 808,736 HUF |
| 16 | Nógrád | 144,484,180,688 HUF | 182,459 | 791,872 HUF |
| 17 | Vas | 175,039,130,103 HUF | 249,513 | 701,523 HUF |
| 18 | Fejér | 278,662,923,480 HUF | 419,656 | 664,027 HUF |
| 19 | Komárom-Esztergom | 178,949,276,351 HUF | 300,631 | 595,246 HUF |
| 20 | Pest | 595,246 HUF | 1,333,533 | 259,627 HUF |
The indicators, ranked by graph:
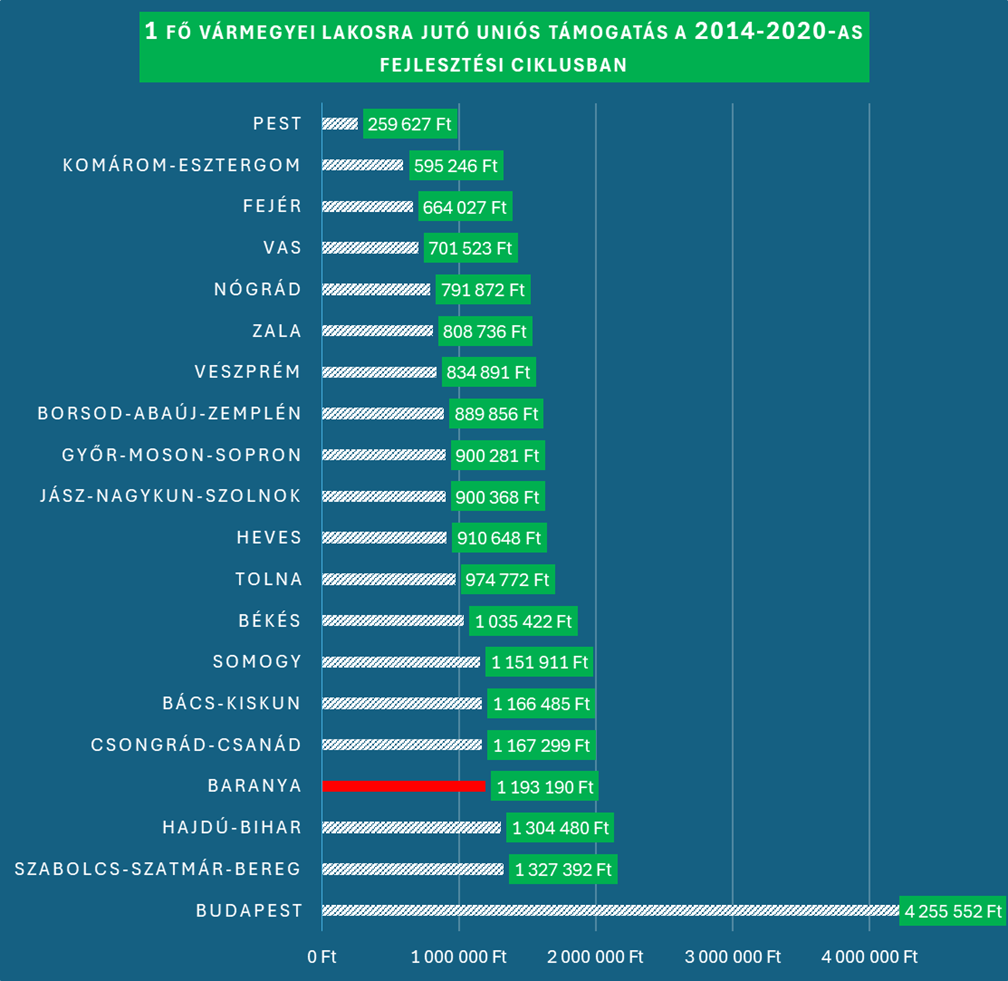
In the per capita ranking, Budapest continues to lead by a wide margin, followed by the counties that have made significant progress in catching up.
It is already clear here that Baranya County ranks high with its 4th-place finish; in other words, the view that Baranya is underfunded and neglected in Hungary’s EU development policy is simply not true. The policy objective of intensively developing the peripheral counties in need of development (Szabolcs-Szatmár-Bereg, Hajdú-Bihar, Baranya, and Csongrád-Csanád-Csanád) is clearly evident from the above ranking.
It is important to note, however, that this analysis does not cover projects implemented by the central government, or to individual subsidies and tax breaks granted to multinational companies establishing operations in the country; nevertheless, it clearly demonstrates that Baranya, which is so important to us, played a prominent role and enjoyed significant prestige during the now-concluded EU cycle.
In the next installment of our series, we will focus our analysis on the sectoral distribution and internal proportions of projects in Baranya County.